Could 50 Be the New 20?
Even the most gracefully aging person would struggle to claim with a straight face that fifty years does not take a toll on the body, leading to dreams of returning to one’s twenties.
Some things are better as you approach your silver years — stability in your career, family and friendships — but there is a reason why we talk about recapturing some of our lost youth. There is one clear area, however, where we are dreaming about fifty years instead of twenty: the US Treasury market.

A tough start for a young bond
Figure 1 compares the yield curve from a year ago to the yield curve today. Since the reissuance of the infamous 20-year bond two years ago, bond investors have been particularly interested in the growing distortion between the 20-year and 30-year points. Over the last year, the 20-year vs. 30-year spread has tightened from 5 basis points to -60 basis points.
Figure 1: Yield curve one year ago vs. today
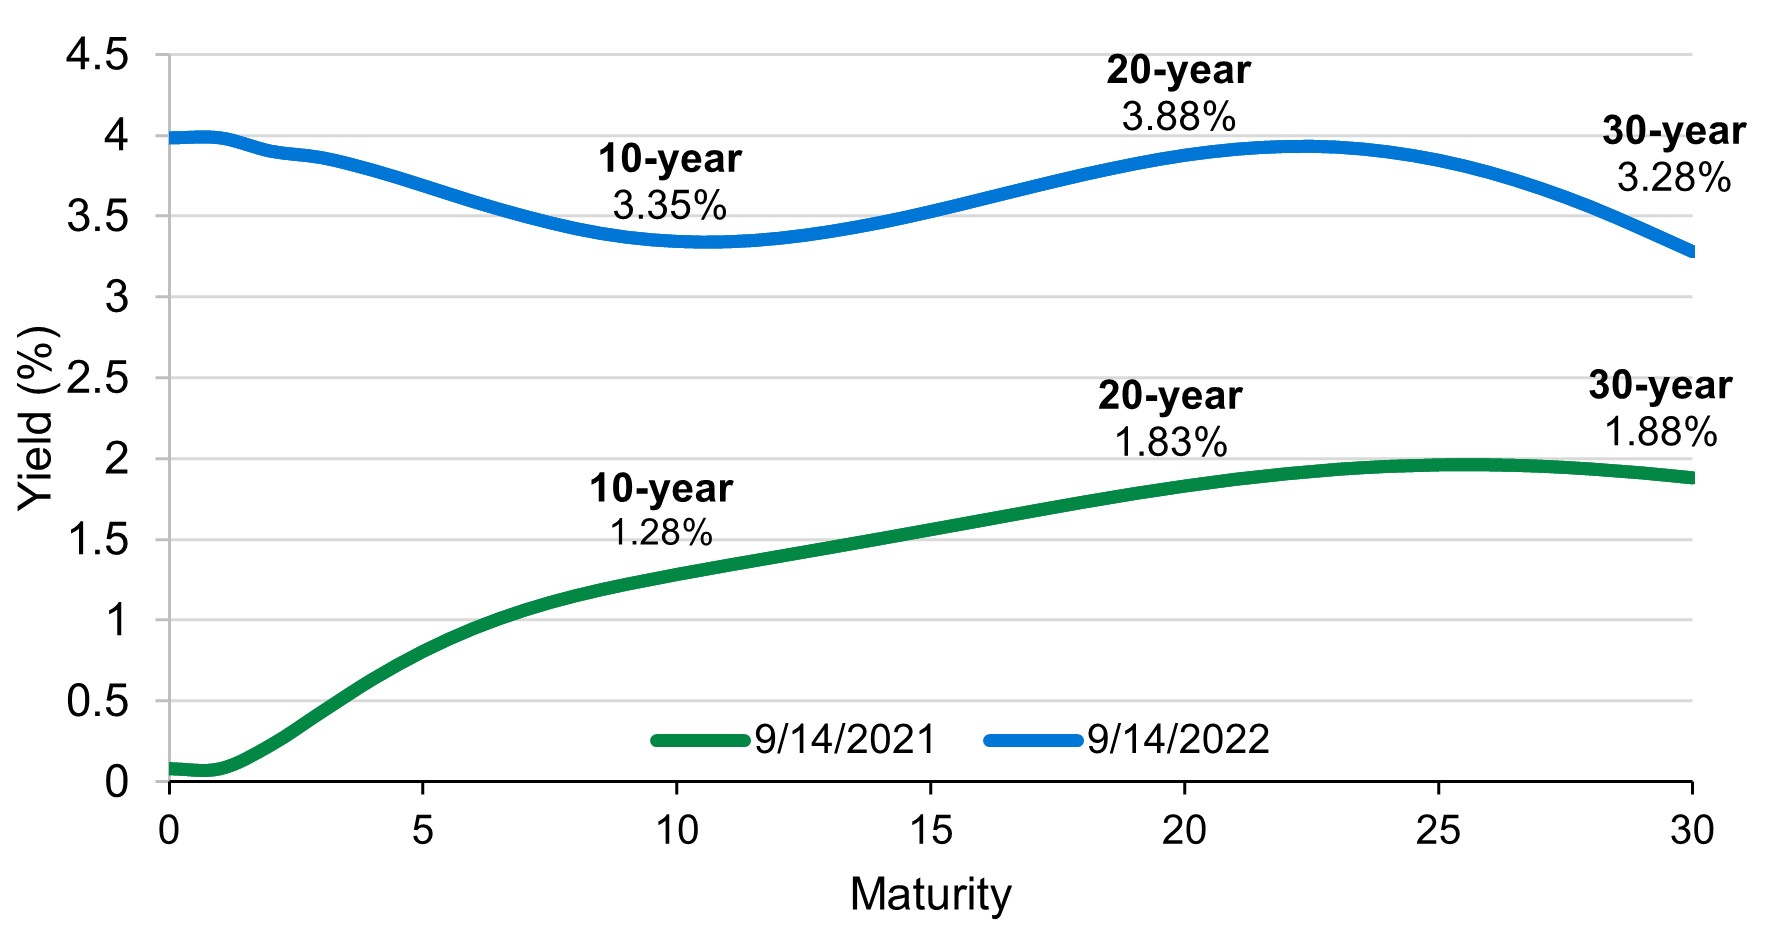
Source: ICE, Bank of America. For illustrative purposes only.
The failure to launch of the 20-year Treasury has been closely followed by market participants over the last two years. When the US Treasury reintroduced the 20-year as they sought to capitalize on favorable financing conditions, the theory was that it would find a natural home in the market as a reference bond for 20-year corporate issuance. This anticipated symbiotic relationship with the corporate bond market was the principal reason the 20-year beat out other candidates, namely a 50- or a 100-year bond.
Unfortunately for taxpayers, the 20-year bond has instead become an orphan, trading at a meaningful relative spread to its 10-year and 30-year peers. And, this spread has steadily increased since its 2020 reissuance, resulting in significant relative cheapness (and higher interest costs to taxpayers) without a corresponding uptick in demand.
The age-old question — which came first?
The 20-year is trapped in a chicken-and-egg situation: the bond is volatile and illiquid because it has been shunned by the market, and it is avoided by investors precisely for that reason.
Liquidity follows a circular logic: a market is liquid because it has many buyers and sellers, and buyers and sellers are drawn to markets with plenty of liquidity. The 20-year suffers from both a lack of liquidity and lack of demand. Because the 20-year Treasury had the unintended consequence of essentially destroying 20-year corporate issuance (i.e., as it traded cheaper and cheaper, it made it more expensive for corporate entities to issue a 20-year bond than a 30-year bond), there are no other natural long-term holders of 20-year Treasury debt other than perhaps pension plans. Nevertheless, many pension plans have long duration corporate bond allocations which generally put them overweight the 20-year point of the curve in relation to their liabilities, thus reducing the usefulness and demand of the 20-year Treasury bond. Even as the Treasury has significantly cut auction sizes in the 20-year bond in response to the distortions in the market, reductions have the unintended consequences of scaring away liquidity dependent investors, further reducing demand.
Other market participants have been less inclined to participate even with 20-year yields trading as cheap as they are now given the need for a large amount of leverage necessary (and rising cost of leverage) to make the trade profitable, and the uncertainty around how the Treasury Department may decide to approach the issue. Many investors such as more short-term focused hedge funds have already been burned in the continued cheapening and broker-dealers no longer have the available balance sheet or appetite to intermediate distortions such as this given capital restrictions.
Would an older bond do better?
Now consider instead the hypothetical silver fox 50-year Treasury. The nature of pension plans having significant liabilities past 30-years indicates to us that there would be much stronger demand for a 50-year. This portion of the liabilities has a higher duration, but most importantly for hedgers, a higher convexity (the second-order effect of interest rate moves). Because liabilities generally have more convexity than the plan’s assets (which only go out approximately 30-years), there is asymmetry to asset/liability management that hurts plans when interest rates rise or fall significantly (i.e., the value of its liabilities will increase at a greater speed than its assets when rates fall and visa versa).
Figure 2 depicts the effects of rate changes ranging from -2% to +2% on the value of a liability with cash flows beyond 30-years that is hedged with 30-year bonds (left chart) and the corresponding impact on funded status (right chart). For the purposes of this illustration, we’ve assumed a liability with cash flows out to 50 years, using a 50-year bond as its proxy for modeling purposes. A basket of duration neutral 30-year bonds is used as the liability hedging instrument. When compared side by side, you can clearly see the effects that convexity has. Specifically, the 30-year bond is unable to keep up with the ever-increasing liability even as interest rates fall, and it also falls short of providing a hedge even as interest rates rise. The convexity factor bites in both directions.
Generally, LDI managers utilize physical 30-year bonds and total return swaps on long Treasuries and STRIPS to hedge the liabilities past 30-years, leaving a convexity gap between the instruments used and liabilities hedged. Introducing a 50-year maturity bond would allow pension plans to better hedge their long-tailed liabilities (which have higher convexity), decrease funded status volatility and ensure better chances of being able to pay benefits they have promised in the future.
Figure 2: Illustrative impacts of a mismatched liability and asset convexity profile

Source: LGIM America. For illustrative purposes only.
Beyond pension plans, we suggest that more return-oriented investors would also be natural buyers of these longer dated securities given they are higher octane when it comes to interest rate sensitivity and risk-off hedging power. For instance, risk parity investors, especially those with constraints on derivative usage, would likely gravitate to 50-year Treasuries to get more bang for their buck. The UK Gilt and US swap markets supports this theory. Figure 3 shows a table of yields of various tenors in UK Gilts, US swaps, and US Treasuries. Notably the dynamic (i.e. negative spreads) between the 30-year to 50-year maturities in Gilts and swaps suggests that market participants are willing to pay more for duration and convexity where instruments exist, especially in times of higher interest rate volatility. In the UK, it’s also important to note that the demand for 50-year Gilts is primarily pension demand. We acknowledge that a 50-year would likely erode some demand for the 30-year, but still believe there is a strong case to be made for its benefits.
Figure 3: Long-end yields for UK Gilts, US swaps and US Treasuries
|
20-year |
30-year |
50-year |
|
|---|---|---|---|
|
Interest Rate Swap |
3.4% |
3.2% |
2.7% |
|
UK Gilts |
3.5% |
3.5% |
3.2% |
|
US Treasury Bond |
3.8% |
3.5% |
?? |
Source: Bloomberg. For illustrative purposes only.
In a lot of categories — electronics, aircraft and houses — a twenty-year old has natural advantages over a fifty-year old. But this narrow corner of the US Treasury market may be more like a fine wine where older tends to be better. It’s time for the Treasury to acknowledge that the reissuance of the 20-year Treasury might have been a failed experiment and should reconsider introducing a 50-year Treasury. Why not replace an unnecessary expense for US taxpayers with a bond that could benefit society by lowering debt service for our country and taxpayers while also assisting investors with long-tail liabilities, better hedges, and lower risk?
Disclosures
This material is intended to provide only general educational information and market commentary. This material is intended for Institutional Customers. Views and opinions expressed herein are as of the date set forth above and may change based on market and other conditions. The material contained here is confidential and intended for the person to whom it has been delivered and may not be reproduced or distributed. The material is for informational purposes only and is not intended as a solicitation to buy or sell any securities or other financial instrument or to provide any investment advice or service. Legal & General Investment Management America, Inc. does not guarantee the timeliness, sequence, accuracy or completeness of information included. Past performance should not be taken as an indication or guarantee of future performance and no representation, express or implied, is made regarding future performance.
The material in this presentation regarding Legal & General Investment Management America, Inc. (“LGIMA”) is confidential, intended solely for the person to whom it has been delivered and may not be reproduced or distributed. The material provided is for informational purposes only as a one-on-one presentation, and is not intended as a solicitation to buy or sell any securities or other financial instruments or to provide any investment advice or service. LGIMA does not guarantee the timeliness, sequence, accuracy or completeness of information included.
The information contained in this presentation, including, without limitation, forward looking statements, portfolio construction and parameters, markets and instruments traded, and strategies employed, reflects LGIMA’s views as of the date hereof and may be changed in response to LGIMA’s perception of changing market conditions, or otherwise, without further notice to you. Accordingly, the information herein should not be relied on in making any investment decision, as an investment always carries with it the risk of loss and the vulnerability to changing economic, market or political conditions, including but not limited to changes in interest rates, issuer, credit and inflation risk, foreign exchange rates, securities prices, market indexes, operational or financial conditions of companies or other factors. Past performance should not be taken as an indication or guarantee of future performance and no representation, express or implied, is made regarding future performance or that LGIMA’s investment or risk management process will be successful.
Hypothetical performance results have many inherent limitations and no representation is being made that any account will or is likely to achieve profits or losses similar to those shown. In fact, there are frequently sharp differences between hypothetical performance results and the actual results subsequently achieved by any particular trading program.
One of the limitations of hypothetical performance results is that they are generally prepared with the benefit of hindsight. In addition, hypothetical trading does not involve financial risk, and no hypothetical trading record can completely account for the impact of financial risk in actual trading. For example, the ability to withstand losses or to adhere to a particular trading program in spite of trading losses are material points which can also adversely affect actual trading results. There are numerous other factors related to the markets in general or to the implementation of any specific trading program which cannot be fully accounted for in the preparation of hypothetical performance results and all of which can adversely affect actual trading results. Moreover, all hypothetical results are presented gross of fees throughout this presentation.
The use of hypothetical performance is subject to inherent limitations derived from the reliance on historical data and the benefit of hindsight. All trading strategies applied to the analysis were available throughout the performance period. However, the analysis includes certain assumptions where actual performance could be different from the hypothetical performance presented.
Unless otherwise stated, references herein to "LGIM", "we" and "us" are meant to capture the global conglomerate that includes Legal & General Investment Management Ltd. (a U.K. FCA authorized adviser), LGIM International Limited (a U.S. SEC registered investment adviser and U.K. FCA authorized adviser), Legal & General Investment Management America, Inc. (a U.S. SEC registered investment adviser) and Legal & General Investment Management Asia Limited (a Hong Kong SFC registered adviser). The LGIM Stewardship Team acts on behalf of all such locally authorized entities.
We have more blogs to share
Visit our blog site to explore our latest views on markets, investment strategy and long-term themes.