2020: Are We Out of the Woods Yet?
Exploring options strategies as downside protection and a funded status stabilizer for US corporate pension plans

To put it mildly, 2020 has been a tumultuous and upending year. For US pension plans, the S&P 500 hitting its all-time high last week showed a glimpse, albeit clouded, of silver lining and hope that we are past the worst of the pandemic. This has been well needed relief after a funded status rollercoaster for many plans as Treasury rates flirt with zero, unemployment remains in double digits and social anxiety is at elevated and polarizing levels as we approach a presidential election. To borrow an analogy from the Brothers Grimm, what could go wrong for our Little Red Riding Hood as she leaves the forest and approaches grandma’s house?
It may seem that as risk managers it's never a bad time for us to discuss equity protection, but today we find it particularly relevant. Current market conditions make implementing a protection strategy for the remainder of the year attractive tactically, in addition to its strategic risk management appeal. While the Fed’s ability to support markets during these times has proven effective and we hope that their success continues, hope is not a prudent risk management strategy.
Assessing the payoff profile
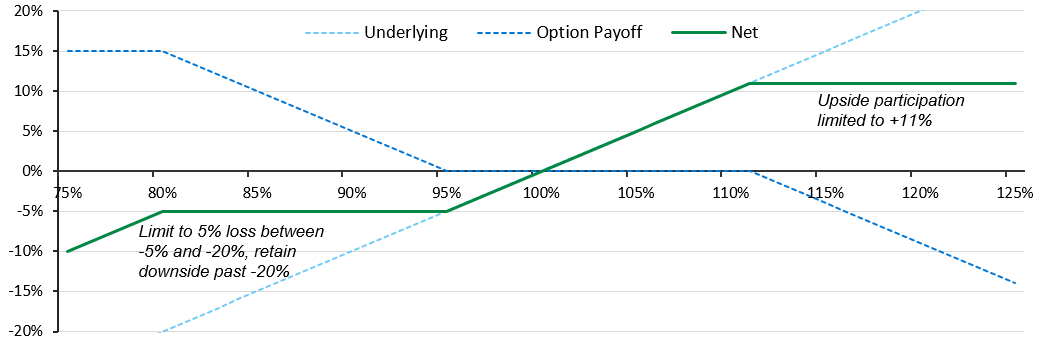
First, let's review the mechanics of equity protection. There are two main implementation questions. First, how much downside protection does an investor desire? Second, how much upside must she relinquish to purchase the put option that achieves that level of protection?
An investor may sell a call option at a strike somewhere above today's level, providing the funds to purchase the put option (taken together this is called a collar). One unfortunate reality of options pricing is the "skew". Simply, skew is a concept that causes the following to be true: For a put and call that are equally as far out-of-the-money with the same expiry date, the put will command a higher premium than the call.
To deal with the skew, and even use it to her advantage, the investor can sell a second put that is even further out-of-the-money, allowing for a higher strike price on the call option, but causing her to reenter the market exposure if the sell-off is more dramatic than expected. This structure is called a put-spread collar. By simultaneously selling a call above today's market level, the overall structure can produce a net $0 premium.
Figure 1: 80-95 put-spread collar payoff profile
Source: LGIM America.
Opportunities in the skew
It is worth noting that supply and demand dynamics over the past few months have caused pricing to move favorably for investors looking to implement a protection strategy. The implied volatility of relatively more out-of-the money puts has increased more than less out-of-the-money puts, leading to the potential to keep more upside participation (i.e. higher call strike). This was most pronounced in April of this year and has retraced some since then but is still higher than where we've observed historically.
Beyond equity options, swaption market dynamics present an interesting opportunity as well. A plan willing to sell a payer swaption on a rich point of the interest rate volatility curve could use the premium collected to increase the participation upside on the equity call option, or perhaps not sell a call all together. This premium today is elevated, based on higher market expectations of implied prospective interest rate volatility.
Selling a payer swaption allows a plan to monetize a hedging decision. If interest rates rise more than the strike level, the plan is placed into a higher interest rate hedge and if rates do not rise higher than the strike, the plan keeps the premium collected.
Funded status volatility reduction
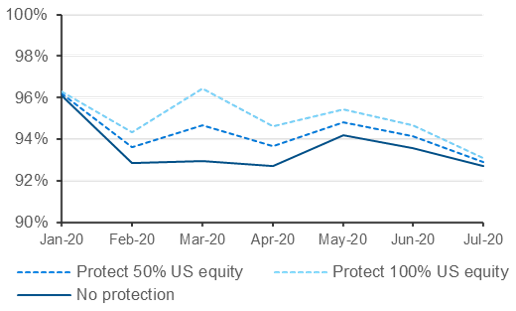
In our March Insights post titled What to do in volatile markets, we explored a case study of a client that collared about half of their liquid US equity portfolio at the beginning of the year using a nearly costless collar structure.1 In January 2020, the plan bought a 85% put and sold a 107% call (later upsizing the structure by buying a 91% put and selling a 105% call). In figure 2 we show the funded ratio progression under three scenarios (no protection, protection on 50% of the US equity exposure, and protection on 100% of US equity exposure).
Figure 2: 2020 Funded ratio progression
Source: LGIM America.
Both the equity sell-off and decreasing interest rates caused funded status degradation throughout the year. (For further context, the plan in this case study targets a 70% interest rate hedge ratio). While we maintain that hedging uncompensated interest rate risk is a key tool to reduce funded status volatility, this illustrates how equity protection can further achieve funded status stability.
While this client did not end up exercising the options for profit, and their funded status is the same as had they not implemented a protection strategy, this collar did create a smoother funded status journey throughout 2020.
Funded status volatility represents the risk that is nearest and dearest to a plan sponsor's heart. Any strategy that can reduce that volatility while also allowing the assets to grow should be desirable. With equity markets at record highs and the prospect of significant market volatility--given uncertainty about the virus and upcoming elections in November--reducing that funded status volatility through an options strategy may be an especially prudent course.
1. Case study chosen because it shows earliest client to implement equity protection in 2020 prior to coronavirus market disruption, thereby highlighting outcome experienced by an early mover pre-, during and post-market disruption. Funded ratio progression outcome of other investors who adopted equity protection is available upon request.
Disclosures
This material is intended to provide only general educational information and market commentary. Views and opinions expressed herein are as of August 2020 and may change based on market and other conditions. The material contained here is confidential and intended for the person to whom it has been delivered and may not be reproduced or distributed. The material is for informational purposes only and is not intended as a solicitation to buy or sell any securities or other financial instrument or to provide any investment advice or service. Legal & General Investment Management America, Inc. does not guarantee the timeliness, sequence, accuracy or completeness of information included. Past performance should not be taken as an indication or guarantee of future performance and no representation, express or implied, is made regarding future performance.
We have more blogs to share
Visit our blog site to explore our latest views on markets, investment strategy and long-term themes.