Judging the Success of SFA Portfolios

According to the Pension Benefit Guaranty Corporation (PBGC), approximately $97 billion in special financial assistance (SFA) is expected to be disbursed to over 250 multi-employer plans.1 At the time of this publication, approximately $53.9 billion in SFA funding has been paid out to multi-employer plans, while close to two-thirds of the estimated total has been approved or is currently under review.2
During the program’s first three years, industry stakeholders’ attention has been centered on portfolio construction and, more recently, understanding the trade-offs of the credit vs. Treasury decision (and, in some cases, equities). In our view, the SFA program is entering a new phase - in which the focus transitions from portfolio design to portfolio monitoring. As of March, over 100 multi-employer plans have received funding and seemingly implemented (or are in the process of) an SFA-specific mandate. If our conversations and experience serve as a representative sample set, many of these portfolios are custom fixed income strategies, often cashflow-matching, that are built benchmark-agnostic. The question becomes, how do we benchmark these mandates?
Figure 1: Simplistic framework to determine success of SFA mandates
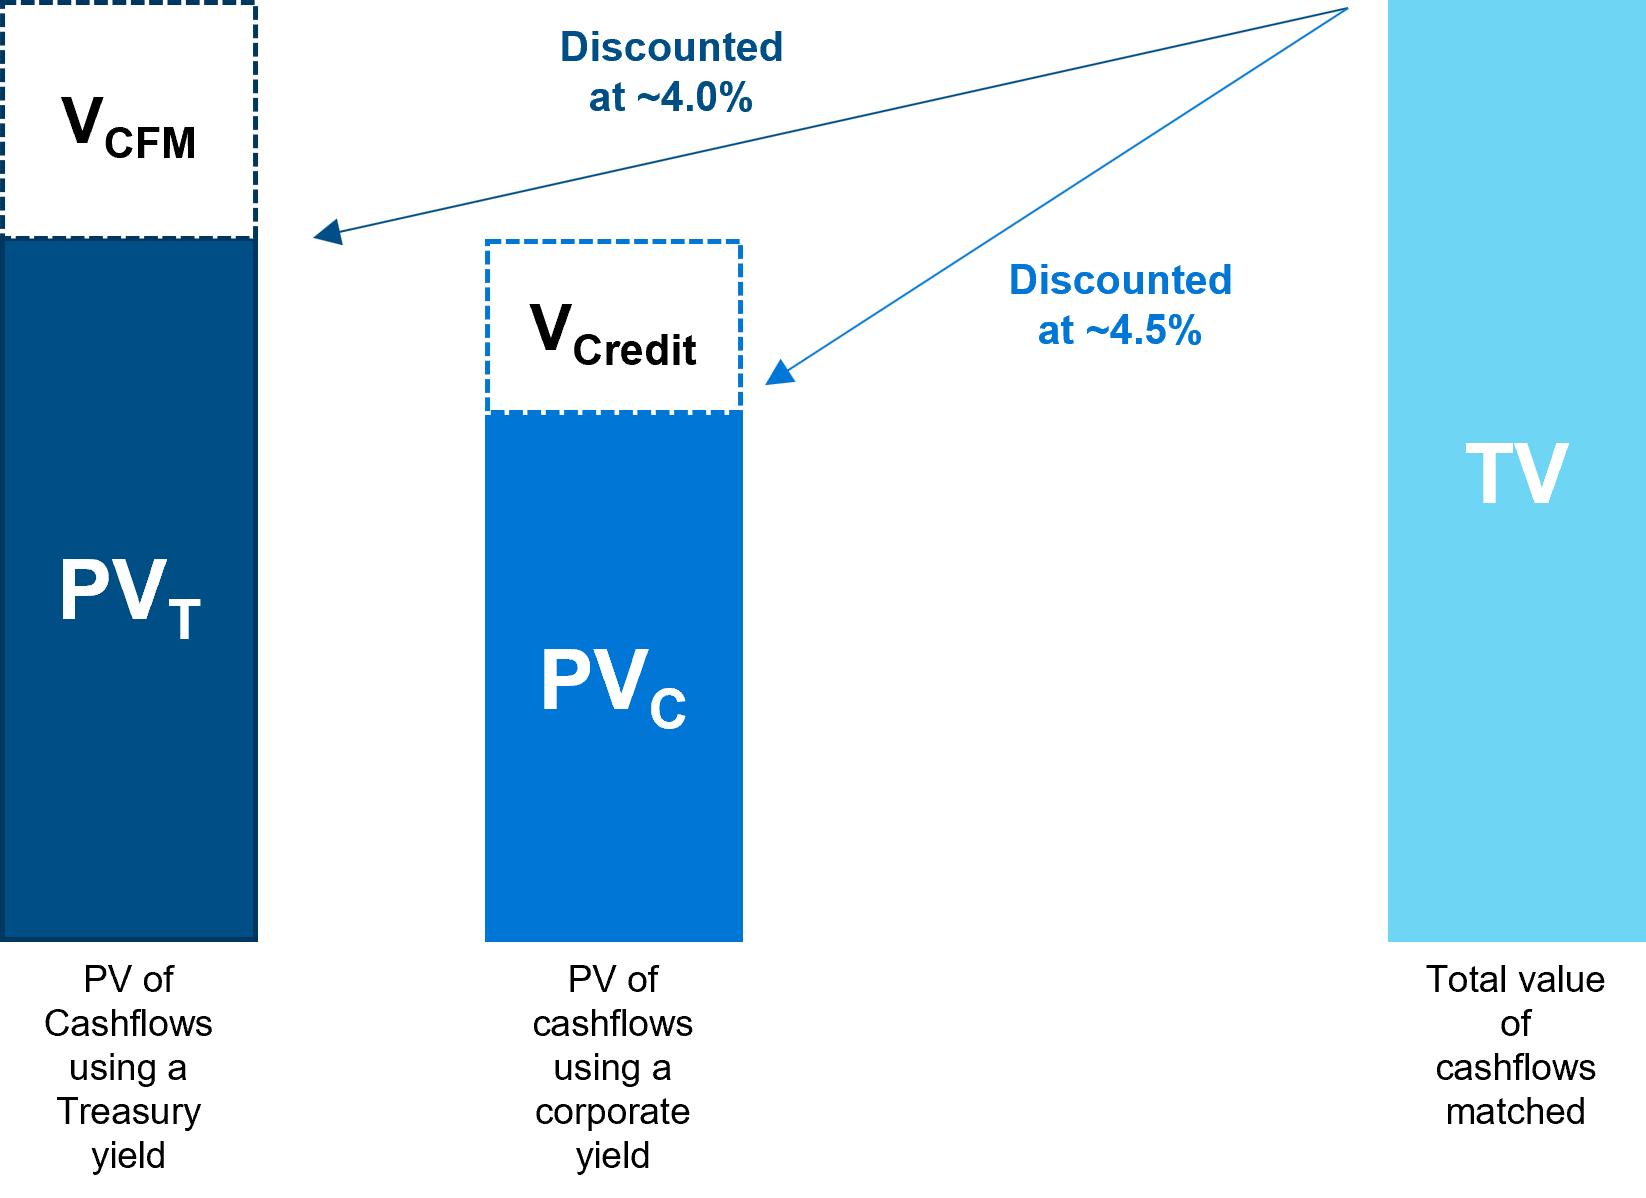
Source: LGIM America. For illustrative purposes only.
- TV represents total value of the liability cashflows that are being matched by the SFA capital.
- PVT represents present value of those cashflows discounted at a Treasury yield. For our purposes, we’ve assumed Treasuries yield 4%.
- VCFM represents the value of building a cashflow-matching portfolio with Treasuries.
- PVC represents present value of the cashflows using the target portfolio benchmark yield, incorporating corporate bonds and a downgrade and default assumption.
- VCredit represents the value (over Treasuries) of building a cashflow-matching credit portfolio, while avoiding downgrades and defaults.
In our illustrative example, the target portfolio benchmark yield assumes a spread on a cashflow-matching credit portfolio of 100 basis points. We also believe the benchmark yield should be adjusted for downgrades and defaults. For illustrative purposes, we use an assumption of 50 basis points.
Figure 2: Target portfolio benchmark - Yield breakdown

Source: LGIM America. For illustrative purposes only.
It is the responsibility of the manager to build a high-quality portfolio that outperforms the benchmark yield by actively avoiding downgrades and defaults. If the manager is successful, the actual portfolio will earn a higher yield, delivering consistent alpha versus the portfolio benchmark.
Figure 3: What performance success looks like
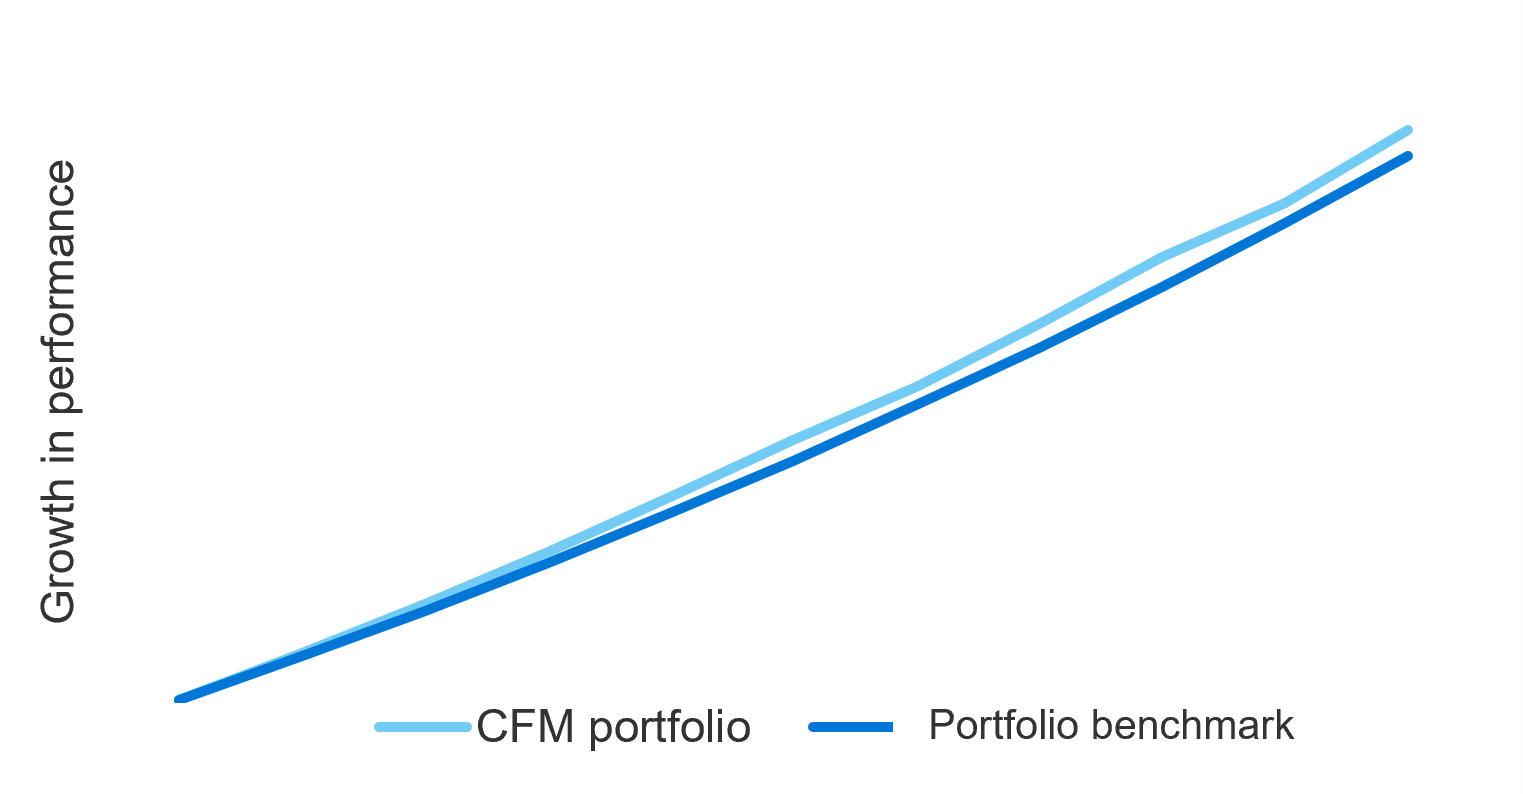
Source: LGIM America. For illustrative purposes only.
The actual portfolio (“CFM Portfolio”) will grow based on the realized portfolio yield and downgrade and default experience over time. The portfolio will be evaluated against the performance of “PVC” from the first illustration. This represents a credit portfolio with a downgrade and default assumption baked into the yield. As long as the manager avoids deteriorating names in the credit market, the portfolio can generate modest outperformance relative to the benchmark.
We believe this framework captures the essence of the special financial assistance program and the intended goal of many SFA recipients. The PBGC is providing a lifeline to hundreds of multi-employer plans. Many have made the decision to implement conservative, cashflow-matching portfolios that cover a set number of expected benefit payments. One of the factors that could hinder the plan from achieving their stated goal of matching X number of years of benefit payments is experiencing a downgrade or default. Establishing a benchmark to evaluate a manager’s performance against this objective makes sense to us.
Benchmarking custom fixed income strategies is not straightforward. At LGIM America, we have the experience and desire to partner with those who own the decisions around the SFA capital. If you’d like to explore our approach in greater depth, please contact us.
1. Source: Pension Benefit Guaranty Corporation (pbgc.gov). American Rescue Plan Act FAQs.
2. Source: PBGC. Data as of March 29, 2024.
Disclosures
Unless otherwise stated, references herein to "LGIM", "we" and "us" are meant to capture the global conglomerate that includes Legal & General Investment Management Ltd. (a U.K. FCA authorized adviser), LGIM International Limited (a U.S. SEC registered investment adviser and U.K. FCA authorized adviser), Legal & General Investment Management America, Inc. (a U.S. SEC registered investment adviser) and Legal & General Investment Management Asia Limited (a Hong Kong SFC registered adviser). The LGIM Stewardship Team acts on behalf of all such locally authorized entities.
This material is intended to provide only general educational information and market commentary. This material is intended for Institutional Customers. Views and opinions expressed herein are as of the date set forth above and may change based on market and other conditions. The material contained here is confidential and intended for the person to whom it has been delivered and may not be reproduced or distributed. The material is for informational purposes only and is not intended as a solicitation to buy or sell any securities or other financial instrument or to provide any investment advice or service. Legal & General Investment Management America, Inc. does not guarantee the timeliness, sequence, accuracy or completeness of information included. Past performance should not be taken as an indication or guarantee of future performance and no representation, express or implied, is made regarding future performance.
We have more blogs to share
Visit our blog site to explore our latest views on markets, investment strategy and long-term themes.