The Pension Hurdle Rate
Pension plans face financial challenges – balancing investment risk and return, seeking stability in funded status and contributions, and coordinating pension risk management with the overall risk budget for the enterprise. Financial management efforts involve trade-offs and coordination of financial policies (investment policy, funding and cost/liability management). At LGIMA, we find that a straightforward way to assess how financial policies work together to achieve objectives is the pension hurdle rate.1 The pension hurdle rate is defined as the return required for asset growth to keep pace with liability growth. If the plan’s asset growth meets or exceeds the hurdle rate, funded status stability (or improvement) is achieved.

The pension hurdle rate is based on two key parameters:
- The liability growth rate, which comprises the discount rate plus rate of benefit accrual, and;
- The plan’s funded status. Underfunded plans need assets to work harder to keep up with liabilities, and overfunded plans benefit from returns on excess funding.
Plan liabilities grow with the passage of time at the plan discount rate. The higher the discount rate, the lower the liability and therefore the higher the required asset growth rate to ultimately support the value of earned benefits. The liability also increases as employees earn additional benefits for continued service to the plan sponsor (often referred to as the service cost). The combination of the interest growth rate and the benefit accrual or service cost growth rate, defines the overall growth rate for the liability. The pension hurdle rate is the liability growth rate divided by the plan’s funded status. Consider the following example: a hypothetical plan has a liability growth rate of 6% (4% discount assumption used to determine liabilities plus 2% service cost rate) and is 75% funded relative to the plan’s actuarial liability. The plan hurdle rate is 8%.
8% = (4% + 2%) / 75%
So, this sample plan needs assets to grow at 8% in order to keep up with a liability growing at 6%. Let’s assume this plan has a contribution budget for the next few years that is about 3% of plan assets. This would suggest that plan assets need to earn 5% (8% - 3% = 5%) in order to meet the hurdle rate.
We can calculate a grid showing hurdle rates at various levels of funding and liability growth. Figure 1 displays hurdle rates assuming funded status ranging from 80-110%, and liability growth from 3-9% of the liability.
Figure 1: Pension hurdle rates
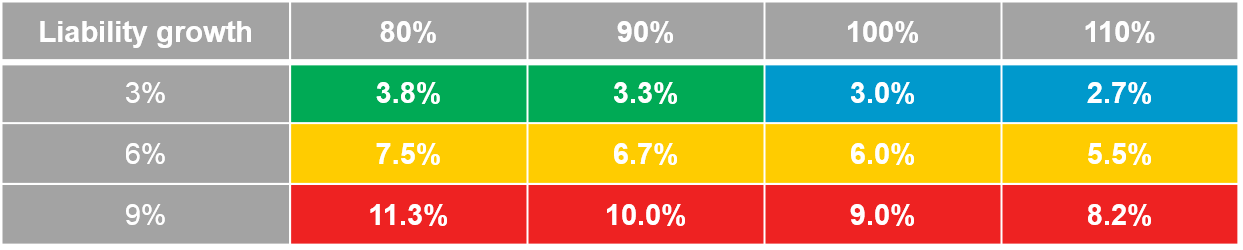
Charts depicted above are intended for illustrative purposes only.
We observe that differently situated pension plans and plan sponsors make different decisions about how to manage the plan. How much to contribute? How to invest the assets? How to monitor and manage risk? Even how to measure plan liabilities and cost?
- Well-funded frozen plans (3% liability growth rate illustrated above – and over 100% funded) often employ liability driven investing (LDI)2 strategies to minimize risk, sometimes in preparation for a pension risk transfer (PRT)3 to an insurance company.
- Underfunded frozen plans (3% liability growth and underfunded) are apt to use a glidepath4 to move toward a fully hedged position as funded status improves. In the meantime, they may continue to invest a portion of the assets in equities and other return seeking assets (RSA) in order to improve funded status.
- Open corporate plans5 (6% growth rate illustrated above) typically have a balanced approach to investing, with some exposure to RSA and some to fixed income (or liability hedging assets, LHA).
- Public pension plans (9% illustrative liability growth rate) have the highest hurdle rates (due in part to how liabilities are measured).6 These plans also tend to be underfunded and aggressively pursue high returns by investing mostly in RSA.
These varied approaches to pension financial management decisions align quite well with our pension hurdle rate framework. We find the framework provides a convenient reference point for describing how pension financial policies (funding, investment, and cost/liability management) can be coordinated most effectively.
Pension plan sponsors need all the elements of their financial policies to hold together in a cohesive way as well. The pension hurdle rate is a straightforward concept that helps plans and plan sponsors keep a steady hand on the financial controls as they navigate the challenges of pension risk and financial management.
1. LGIMA stands for Legal & General Investment Management America, specializing in customize investment solutions for pension funds and other institutional investors.
2. Liability driven investing means managing plan assets to behave similarly to plan liabilities in order to minimize funded status variability.
3. A pension risk transfer is an annuity purchase from an insurance company that transfers the pension obligation from the pension plan to the insurer.
4. A glidepath refers to a predetermined plan to shift the plan assets from equities to fixed income over time as funded status improves.
5. Open plans are plans that continue to be open to new hires entering the plan, and where active participants continue to earn additional benefits.
6. Public pension plans use the expected return on plan assets as the discount rate while corporate plans use a corporate bond yield curve.
Disclosures
This material is intended to provide only general educational information and market commentary. Views and opinions expressed herein are as of February 2020 and may change based on market and other conditions. The material contained here is confidential and intended for the person to whom it has been delivered and may not be reproduced or distributed. The material is for informational purposes only and is not intended as a solicitation to buy or sell any securities or other financial instrument or to provide any investment advice or service. Legal & General Investment Management America, Inc. does not guarantee the timeliness, sequence, accuracy or completeness of information included. Past performance should not be taken as an indication or guarantee of future performance and no representation, express or implied, is made regarding future performance.
We have more blogs to share
Visit our blog site to explore our latest views on markets, investment strategy and long-term themes.